BeforeTheOff.com uses cookies.
By continuing to use this website you imply consent to cookies being used.
For more information see our Privacy Policy

A Little About the History of Race Guides...

  • Racecards have been in existence since the Victorian era.
  • Apart from a few changes, their content and format has changed little to the present day .. until now …
  • The BTO race guide breaks the mould to that shown above and uses sophisticated statistical techniques to provide revolutionary race information to casual and serious punters.

1. Present numbers only when absolutely necessary

  • Present numbers only when absolutely necessary
  • There’s no getting away from the fact that if a measure or a piece of data has meaning in its magnitude, you cannot hide its value.
  • The BTO race guides do not break this rule so where necessary we will display numerical data on the race guide in a tabula format per the example above

2. Where possible take advantage of the human brain's ability to detect patterns

  • Where possible take advantage of the human brain's ability to detect patterns
  • One of the unique features of the BTO race guide is that it uses a combination of shapes and colours to represent data per the examples above
  • The key benefit is that you don’t waste time trying to detect patterns in a bunch of numbers. When relevant, the BTO race guides present information to you visually and graphically!
    • For Example...Trainer Trend: Using the results of all the trainers runners over a 4 month period, a graphical trend of the trainer's A/E (actual versus expected) statistic is plotted. The shape and direction of the graph provides a visual representation of a trainer's performance over this time period.

3. Utilise modern statistical methods and metrics where appropriate

  • The Flaw Of Averages
  • There are lies, damn lies and statistics, however, some statistics can be extremely useful.
  • The key statistic used in the race card is actual versus expected, commonly known as the A/E index.
  • The A/E index, simply put, is a statistical measure of goodness for a particular group of data.
  • Within the race guides we use the A/E index in a number of areas to benchmark actual wins versus expected wins e.g. trainer course form.
  • The actual wins is derived from real results, the expected win part of the equation is calculated statistically.
  • An actual/expected (A/E) index is a ratio of the actual number of winners compared to the number of winners expected based on their odds.
  • An A/E Index of 1.00 is considered to be as expected.
  • A figure below 1.00 indicates runners are winning fewer times than the odds imply.(worse)
  • Whereas above 1.00 is indicative of runners winning more regularly than expected. (better)
  • Why do the BTO Race Guides use the A/E index?
  • The rationale is as follows:
    • Value is an integral part of the A/E index calculation.
      • In betting if you can identify situations where something is performing better than expected then you have found something that is value i.e. a situation that is not being over bet by the general public or a factor that is being overlooked by the crowd.
    • A/E index statistics are not commonly found in newspapers and the racing media.
  • Making betting decisions using the A/E Index will provide an edge over others who are not using A/E.
  • Race Guides A/E index
  • Use of A/E Index in the race guides, trainer course form example:
    • Eternally's trainer (J H M Gosden) has 21 course wins from 53 runners. His statistical expectation is 15.9 therefore his performances are approx. 30% above expectation (3 green squares).
    • Primobella’s trainer (M Johnston) course form is 20% below expectation (2 red circles, 13 wins from 112 runners)
  • The table format above is also used in jockey, sire, trainer 14 day+ statistical tables

4. Provide information not easily obtainable or not in the public domain.

  • How long does it take to assess the capability of each horse?
    How long does it take to determine if a horse is well handicapped?
    How long does it take to calculate speed ratings?
    How long does it take to determine the pace in the race?
  • These are examples of handicapping activities that take time.
  • Time is a valuable asset for the handicapper. If you have time you can examine all potential investment opportunities available to you. If your time is limited the opposite is true.
  • One of the key design objectives of our race guides was to determine situations where BTO can do the “heavy lifting” for the user and allow you time to focus on your handicapping process!
  • BTO Ratings
  • BTO Plus+ Ratings
  • Ratings of various types appear in all sorts of publications and are typically based on the official BHA rating scale of 0-140 (flat) and 0-175 (jumps). This method is merely unravelling the handicapper's work.
  • Common sense dictates that you cannot outsmart the public if you are handicapping with the same information and methods as the public.
  • Using sophisticated statistical methods, our ratings are different in that they are calculated using software that simulates 1000s of database queries against 7 race factors for each horse in the race.
  • The result is a number, which is converted to the BTO rating odds (F’Cast) and the race guide table is ordered by BTO rating.
  • On average the winner is found in the top 3 BTO rated horse 60% of the time!
  • Is A Horse Well Handicapped?
  • Is A Horse Well Handicapped?
  • Horses running off a mark below their highest winning official rating can in theory win again off that mark
  • The graphic above indicates whether a horse is well handicapped against its official rating (OR) in a handicap of the same race type.
  • If todays OR is higher than horse's highest winning OR (HiOR) the chart indicates red.
  • If the horse's HiOR Is below today's OR the chart indicates green.
  • The figure to the right indicates the number of pounds the official rating is above or below HiOR.
  • Shake The Bucket is running off an OR of 60, 19lbs below its highest winning handicap mark.
  • Manorov is running off an OR of 58, 7lbs above its highest winning handicap mark.
  • BTO Speed Ratings
  • Speed ratings are a measure of a horse's capabilities against the clock.
  • The average punter ignores race times and, given the choice between a previous impressive winner and one that has won in a particularly fast time, they invariably support the impressive winner.
  • They are probably right more often than not, but the edge is with the fast time horses that go off at big prices next time out!
  • That’s why we provide each horse's last time out speed rating in our race guides.
  • The horse's last time out speed rating is scaled from 0-100 and is non weight adjusted.
  • A Faster than Class Indicator
  • A Faster than Class indicator
  • Horses that ran faster than class last time out have demonstrated an ability to beat winners!
  • The "speed" column is the horse's last time out BTO speed rating.
  • This number is compared to the class par for winners at today's race type. The chart indicates how much the rating is above (green) or below (red) this median rating.
  • Dea Dia's speed rating last time out was 52, 9 below the par speed rating for this class.
  • Mademoiselle Penny's speed rating last time out was 72, 11 above the par speed rating for this class.
  • Pace
  • When looking at a race, the first question you should try to answer is: how is this race going to be run?
    • Is it probably going to be won from starting stalls to finishing line
    • Is a horse from the back of the pack likely to run down the leaders?
  • Pace mapping tries to visualise the pace within the race.
  • In conjunction with any draw bias, pace/draw analysis form a powerful weapon in the handicapper's armoury!
  • Pace Handicapping
  • Pace Handicapping
  • The pace column is calculated from the horse's last three runs, the number is then used to map the horse's pace profile on the scale below based on the following key predicted pace style for each runner h = held up, m = midfield, p = prominent, l = led.
  • The draw bias is also shown: green for positive stall, red for negative stalls, the length of the bar indicates by magnitude the advantage/disadvantage.
  • The table details the pace statistics for the course and distance in question. From the data the “course pace bias” can be determined i.e. does the course favour horses that like to lead?
  • Pace Handicapping
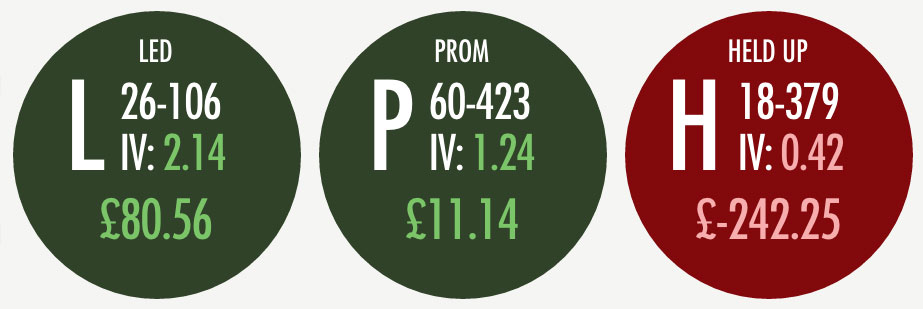
  • The course and distance pace statistics detail the historical record of horses with the following running styles.
    • L for Led, P for Prominent or H for Held Up.
  • The table above details the historical record for each running style at the race distance. From this data you can determine which of the individual running styles is helped or hindered by any track bias.
    • The IV column displays the Impact Value.
      • An impact value (IV) is an index which is a statistical measure of whether a particular running style is performing better or worse than expected.
      • A value of 1.00 would indicate that horses with a particular running style, win no fewer or no more than expected i.e. there is no track bias toward that running style.
      • Below 1.00 is indicative of underperformance, possibly due to a track bias against that style of running.
      • A value greater than 1.00 is above expectation suggesting a track bias which favours horses with that style of running.
    • The “£” column lists the profit and loss for each running style at starting prices to £1 stake.
  • Factoring in the pace style statistics detailed by the BTO race guide for each horse, you can anticipate how the race will unfold under race conditions and provides a powerful tool as part of your selection methods.

5. Handicapping Process


  • The BTO race guide is full of effective handicapping information. Indeed, all the products offered by BTO can be thought of as a large box of handicapping tools.
  • The example below summarises the handicapping process to identify which elements of our race guides should be referenced during the process:
    • ❶ BTO ratings
    • ❷ BTO speed ratings
    • ❸ Well handicapped on official ratings faster than class speed ratings
    • ❹ Positive/negative stats
    • ❺ Sire going/distance stats
    • ❻ Trainer/jockey form
    • ❼ Pace maps
    • ❽ BTO tissue
  • Handicapping Process

Latest Results

WolverhamptonUse Safer Gambling Tools At BetUK Handicap

1 Assembled (9) 7/1
2 Pysanka (3)14/1
3 Cornish Storm (5)11/10 f
Winning Time1:59.48 Winning Tra/JkyM R Bosley/Rob Hornby Runners12 ran / 2 non-runners Distances1 1/2 Length, 1 1/4 Length Tote Win£8.8
Pl££2.40, ££3.80, ££1.10, £2.4, £3.8, £1.1 EX£102.5 Trifecta£322.2 CSF£103.02 StatusWeighedIn

WolverhamptonBetMGM: Stay Golden With Responsible Play Handicap

1 Boujee Gold (2) 20/1
2 Kenstone (5)6/1
3 Hellavapace (3)100/30 f
Winning Time1:09.69 Winning Tra/JkyA W Carroll/William Carson Runners12 ran / 9, 12 non-runners Distanceshd, nk Tote Win£21
Pl£5.3, £1.8, £1.4 EX£173.8 Trifecta£674.4 CSF£137.26 StatusWeighedIn

WolverhamptonSet Deposit Limits At BetUK Handicap (Div II)

1 Bint Al Daar (7) 4/1 cf3
2 Borgi (1)4/1 cf3
3 Avon Light (5)8/1
Winning Time1:18.84 Winning Tra/JkyK A Ryan/Hector Crouch Runners9 ran / 8, 3 non-runners Distancesnk, 3/4 Length Tote Win£5
Pl£2.4 EX£22 Trifecta£131.3 CSF£19.85 StatusWeighedIn

WolverhamptonSet Deposit Limits At BetUK Handicap (Div I)

1 Tiger Beetle (6) 7/2
2 Master Of Combat (3)11/4 f
3 Hale End (8)10/1
Winning Time0:0.00 Winning Tra/JkySir Michael Stoute/Rob Hornby Runners10 ran Distances Length, Length Tote Win£4.8
Pl£1.6, £1.4, £2.8 EX£17.4 Trifecta£121.1 CSF£14.18 StatusWeighedIn

WolverhamptonStay In Control At BetMGM Handicap

1 Intervention (4) 9/2
2 Abbey's Dream (8)25/1
3 Showtime Mahomes (11)8/1
Winning Time87:87.04 Winning Tra/JkyC O'Brien/Alistair Rawlinson Runners12 ran Distances1 1/2 Length, shd Tote Win£5.5
Pl£1.7, £7.7, £3 EX£97.1 Trifecta£1212.8 CSF£115.89 StatusWeighedIn

WolverhamptonUse Safer Gambling Tools At BetMGM Nursery Handicap

1 Never Fear (6) 15/2
2 South Kensington (3)4/1 f
3 Falling For You (1)9/1
Winning Time88:88.39 Winning Tra/JkyCharlie Johnston/Jack Mitchell Runners9 ran Distancesnse, 2 1/2 Length Tote Win£8.5
Pl£2.6, £1.8 EX£38.8 Trifecta£319.9 CSF£37.6 StatusWeighedIn

WolverhamptonSet Deposit Limits At BetMGM Maiden Stakes (GBB Race)

1 Debora's Dream (2) 5/4 f
2 Galloping On (5)100/30
3 Formidable Force (4)5/1
Winning Time88:88.34 Winning Tra/JkyR Varian/Aidan Keeley Runners12 ran Distances1 1/2 Length, 1 1/2 Length Tote Win£2.25
Pl£1.1, £1.5, £1.6 EX£7.6 Trifecta£24.1 CSF£5.65 StatusWeighedIn

NewcastleStay In Control At BetUK Handicap

1 High Opinion (1) 5/1
2 Gowanbuster (3)9/1
3 Nellie French (7)15/2
Winning Time59:59.69 Winning Tra/JkyB Smart/C Lee Runners12 ran Distances1 3/4 Length, nk Tote Win£6
Pl£2.5, £2.4 EX£56 Trifecta£583.3 CSF£49.74 StatusWeighedIn