| BTO 1-2-3 |
The predicted top 3 horses based on simulated queries against several race factors. |
| Speed Rating 1-2-3 |
The fastest horses based on last time out speed. |

|
| # (Cloth number) |
This is the race card number of the horse which is shown on the saddle cloth. |
Horse, DSLR
[Distance, Beaten, Winner, Favourite, etc] |
Horse name and days since last run.
Distance, Beaten, Winner, Favourite (if applicable) |
| Trainer / Jockey |
Trainer & Jockey for this race |
| Rating |
This is the horse's BTO Rating for this race. These ratings are compiled from thousands of variables. |
| Forecast |
The horse's BTO forecast price for this race |
| Age |
Horse age |
| Weight |
Horse weight |
| OR |
The horse's Official handicap Rating |
| SP |
Starting price odds |
|
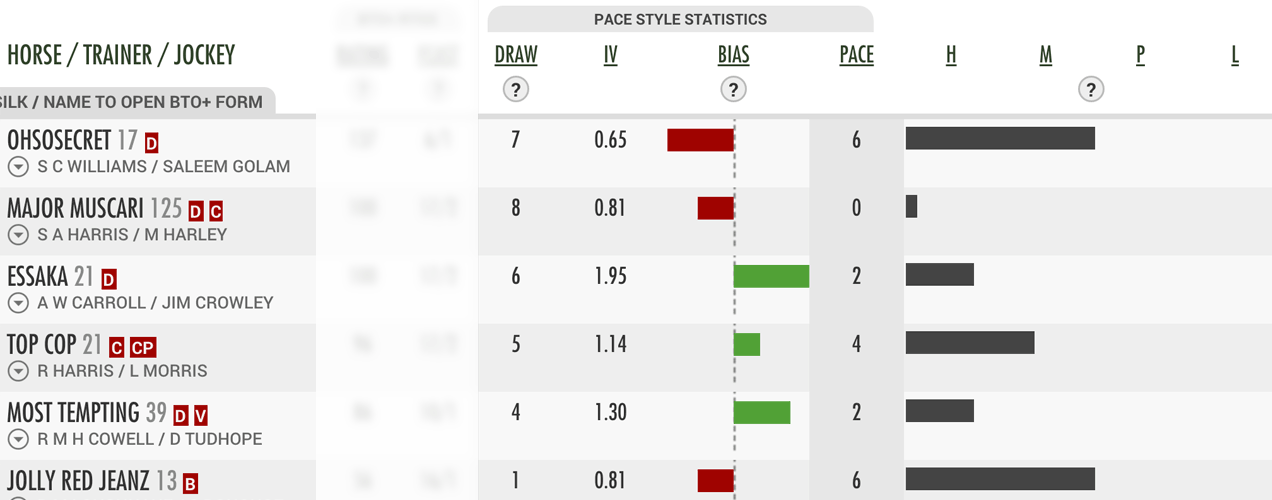
| Draw |
The horse's stall position (flat racing only) |
| IV |
Impact Value is a statisical technique which produces an index. In the simplest terms, above 1 is good, below 1 is bad. |
| Bias |
(Flat Racing Only). A graphic which uses the (i)mpact (v)alue index statistic comparing two groups of data with the same characteristic; in this case individual stall positions, with the statistic plotted visually, positive stalls in green, negative stalls in red |
| Pace |
The pace ratings and Pace % are a guide as to how a race will be run. They are calculated as follows :- we store pace abbreviations for each horse for every run it has, they can be either L for Led, P for Prominent or H for Held Up. Then to calculate a pace rating for an upcoming race we look at the last 3 runs the horse had and allocate points based on the pace abbreviation given as follows :- 4pts for Led, 2pts for Prominent and 0pts for Held Up, so for instance if a horse Led in all of it's last 3 runs it would get a points total of 12pts or if it was Held up in one race, led in another and was prominent in the third race then it would get 6pts. The pace rating column on the race card screen contains this total for each horse and from these the pace percentage column is calculated.
To use these two columns is then simple, if a horse has a percentage of higher than 33% then it is more than likely that it will lead and could even get a soft lead. If there are two or 3 well clear of the rest then one of these will likely lead.
Using these in conjunction with the pace details that are carried for each course and distance along with the draw stats is a powerful tool. |
| H / M / P / L |
A chart representation of pace. |
|
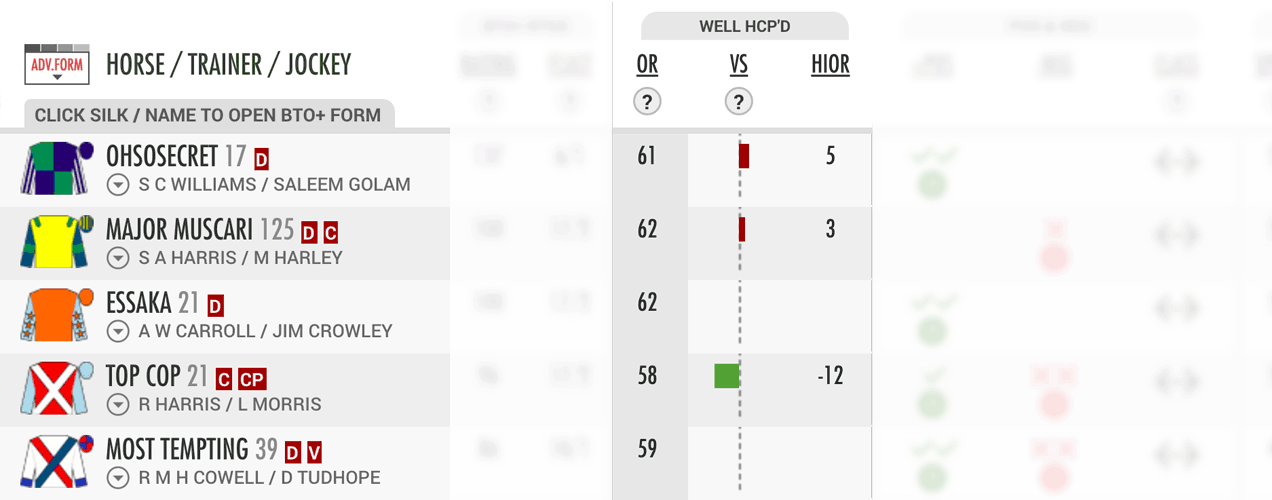
| OR(Handicapped Races) |
BHA Official Rating |
| VS(Handicapped Races) |
Indicates whether a horse is well handicapped against its official rating (OR) in a handicap of the same race type. If todays OR is higher than the horses highest winning OR (HiOR) the chart indicates red. If the horses HiOR Is below todays OR the chart indicates green. |
| HIOR(Handicapped Races) |
Indicates the number of pounds the official rating is above or below HiOR. |
|
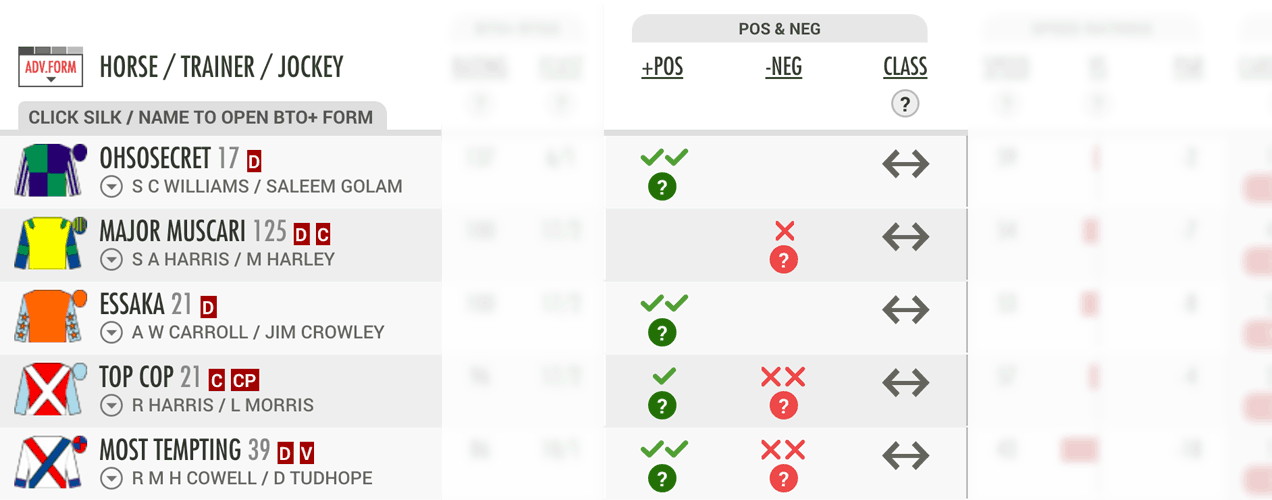
| Pos |
No. of positive notes for horse (hover for details) |
| Neg |
No. of negative notes for horse (hover for details) |
| Class |
Indicates in a race of the same race type whether a horses is dropping in class, running in the same class, or being raised in class h compared to its recent race. |
|
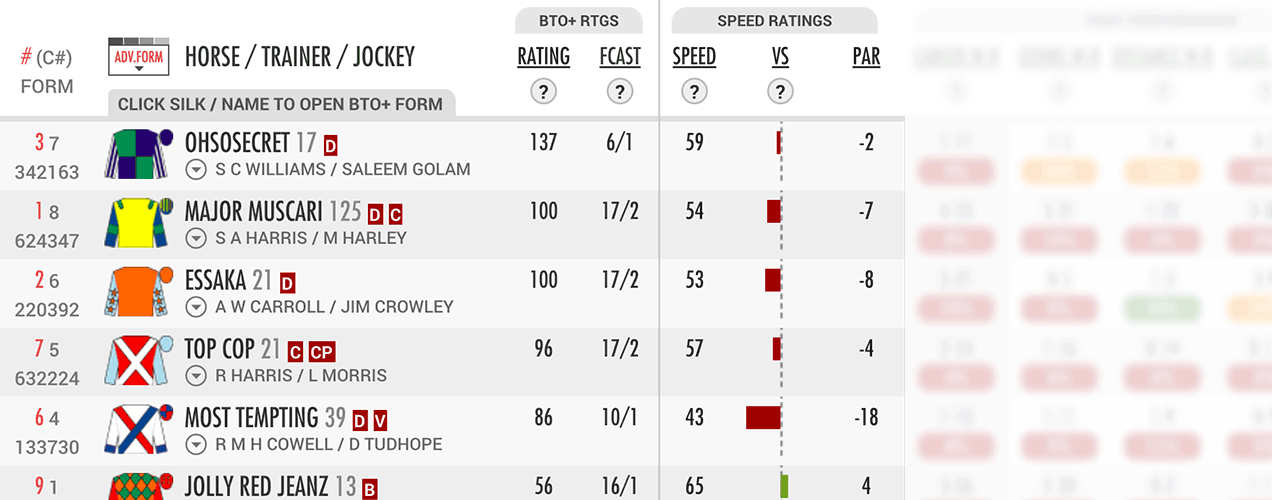
| Speed |
The horses last time out speed rating (0-100) non weight adjusted |
| Vs |
A faster than class indicator. The horses BTO Plus + last time out speed rating, compared to the Class Pars for winners at todays race type. The chart indicates how much the rating is above (green) or below (red) this median rating |
| Par |
Bench speed figure for this class and type of race |
|
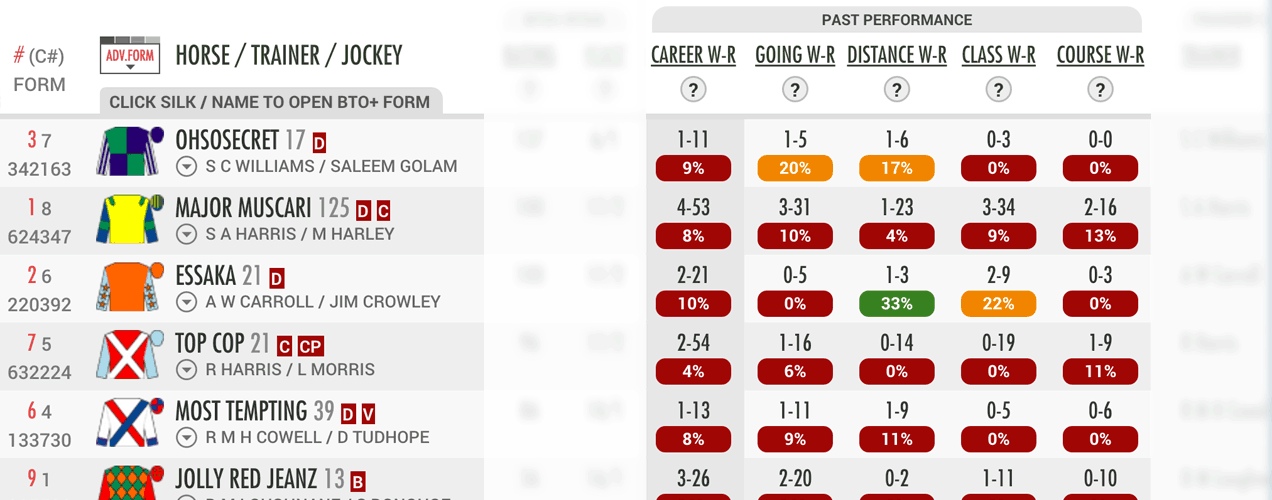
| Career, Going, Distance, Class & Course W-R |
Wins to Runs and Strike Rate (%) |

|
| Trend (Graph) |
Using the results of all the trainers runners over a 4 month period, a graphical trend of the trainers A/E (actual verses expected) statistic is plotted.
The shape and direction of the graph provides a visualisation representation trainers performance over this time period. |
| 14+, 28+ & 56+ day performance:
Trainer & Jockey Statistics:
Trainer Course Statistics:
Jockey Course Statistics:
Sire Distance, Course, Going Statistics:
|
| - W-R |
Wins to Runs and Strike Rate (%) |
| - Exp |
Expected Winners: Statistically derived from the probability of the winners (W) |
| - A/E |
A/E: A ratio of (A)ctual winners verses (E)xpected winners.
A/E provides a good indicator of whether a statistic is good or bad.
Higher than 1.0 is good and lower than 1.0 is bad. Each 0.1 above or below 1.0 represents 10% better or worse. |
- Green Squares
- Red Circles |
Each square represents 10% above or below A/E values of 1.0. e.g. An A/E of 1.2 would display 2 green squares because it is 20% better than expectation, whilst a A/E of 0.3 would show 7 red circles because it is 70% worse than expected. |
|
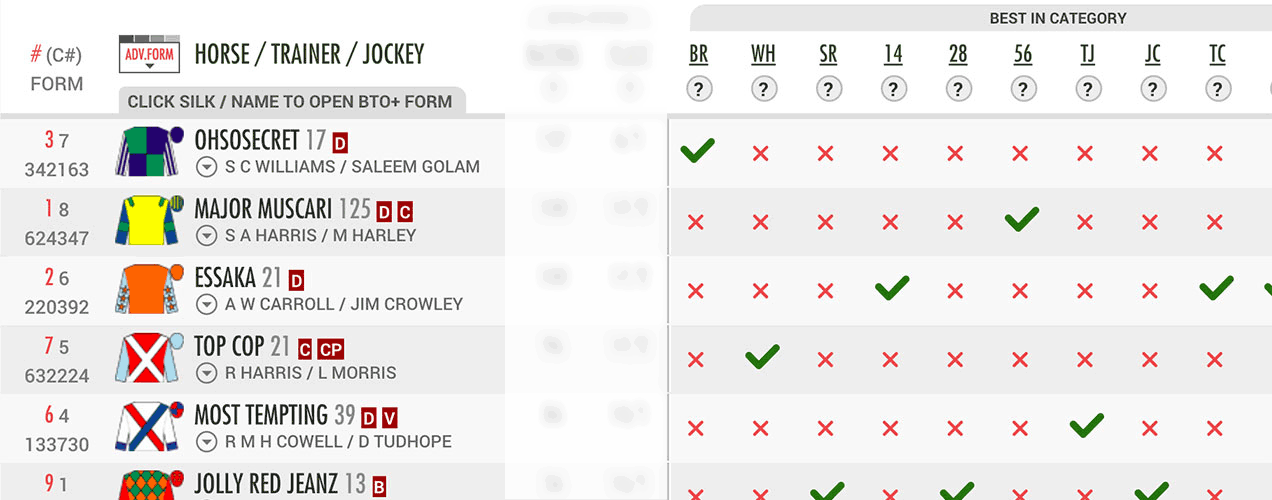
| Best In Category |
Indicates best performer for each racecard section. |

|
Advanced Historical
Form Data |
When logged in clicking a horse's silk or name will open our advanced historical form data. From here you can filter and search historical data covering the horse and it's respective: jockey, trainer, trainer & jockey, owner, sire, dam, and dam sire data.
The system allows fast filtering by variables such as: distance, going, course, race type and much more. |
|
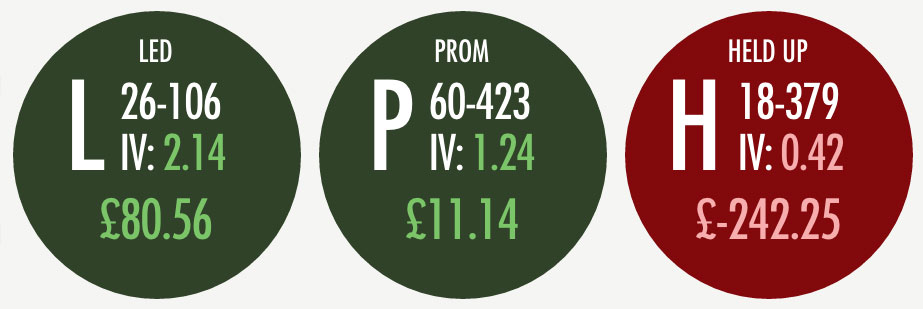
| Course Pace Bias |
Illustrates the historical pace statistics for the course and distance in question. From the data the 'course pace bias' can be determined i.e. does the course favour horses that like to lead?
L for Led, P for Prominent or H for Held Up. |
| IV |
Impact Value.
An impact value (IV) is an index which is a statistical measure of whether a particular running style is performing better or worse than expected.
A value of 1.00 would indicate that horses with a particular running style, win no fewer or no more than expected i.e. there is no track bias toward that running style.
Below 1.00 is indicative of underperformance, possibly due to a track bias against that style of running.
A value greater than 1.00 is above expectation suggesting a track bias which favours horses with that style of running.
|
| £ |
The profit and loss for each running style at starting prices to £1 stake. |
|
| ALERTS: Quickly starting and stopping alerts |
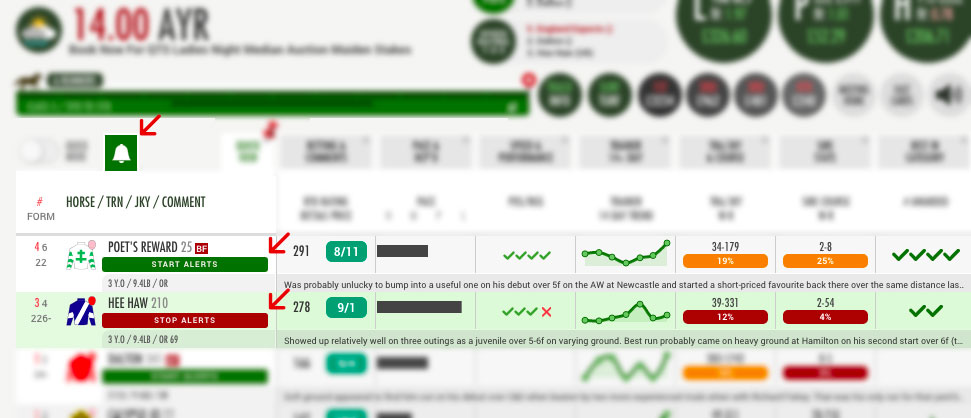
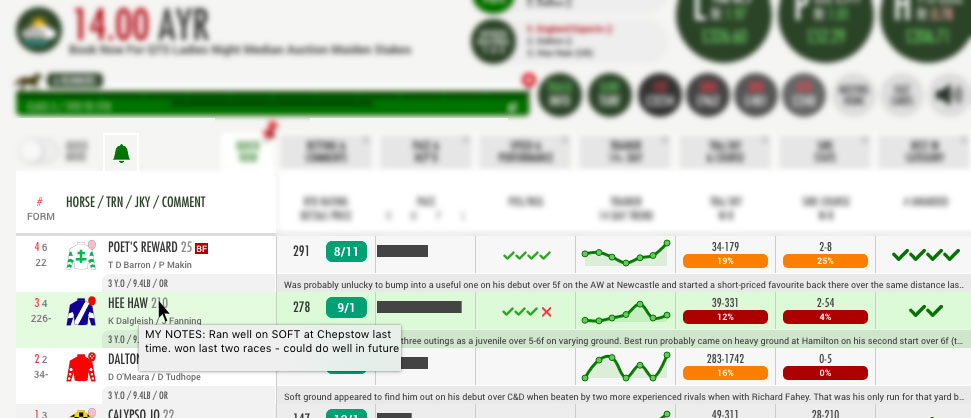
Turning alerts on and off is simple, click the alerts button at the top of the racecard/resultcard and you'll see the start or stop button appear for alerts for any given horse. You can also search for horses in the members area, and have the ability to pause, mass delete and add notes to your alerts. You'll receive a digest email letting you know of runners you have alerts for the next day. BTO Plus+ subscribers can turn off email alerts should they just prefer on-site alerts. |
|
| ALERTS: Adding Notes to your alerts |
You can add notes to your horse alerts for your own future reference. Simply go to the members area (click the avatar symbol in the top right of the menu), find the horse in your stored alerts, and click the notes button. Note that if you delete a horse from your alerts, your notes will be deleted permanently, so if you simply want to stop a horse's alerts with the expectation you might want to pick up with it again in future deactivate that horse's alerts by clicking the corresponding toggle button. |

|
| ALERTS: Quickly view your notes |
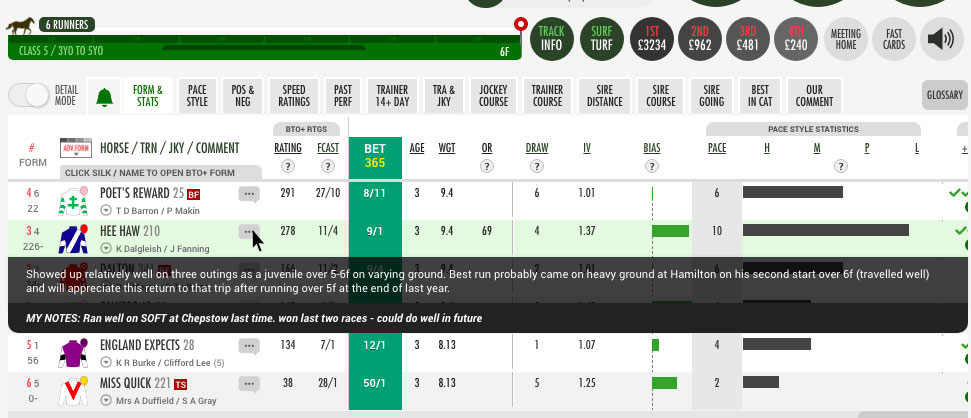
To quickly see the notes you've added to alerts for any given horse hover your cursor over the name of the horse. This tip works site wide - anywhere you see the horse's name in an alert, hovering over it will show you your notes. |
|
| ALERTS: Quickly view your notes (detail mode) |
As well as the above approach your notes are displayed after our comments in detail mode as illustrated above. |
 Assembled (9) 7/1
  Pysanka (3)14/1
  Cornish Storm (5)11/10 f
 Boujee Gold (2) 20/1
  Kenstone (5)6/1
  Hellavapace (3)100/30 f
 Bint Al Daar (7) 4/1 cf3
 Borgi (1)4/1 cf3
 Avon Light (5)8/1
 Tiger Beetle (6) 7/2
  Master Of Combat (3)11/4 f
 Hale End (8)10/1
 Intervention (4) 9/2
  Abbey's Dream (8)25/1
  Showtime Mahomes (11)8/1
 Never Fear (6) 15/2
  South Kensington (3)4/1 f
 Falling For You (1)9/1
 Debora's Dream (2) 5/4 f
 Galloping On (5)100/30
  Formidable Force (4)5/1
 High Opinion (1) 5/1
  Gowanbuster (3)9/1
  Nellie French (7)15/2


